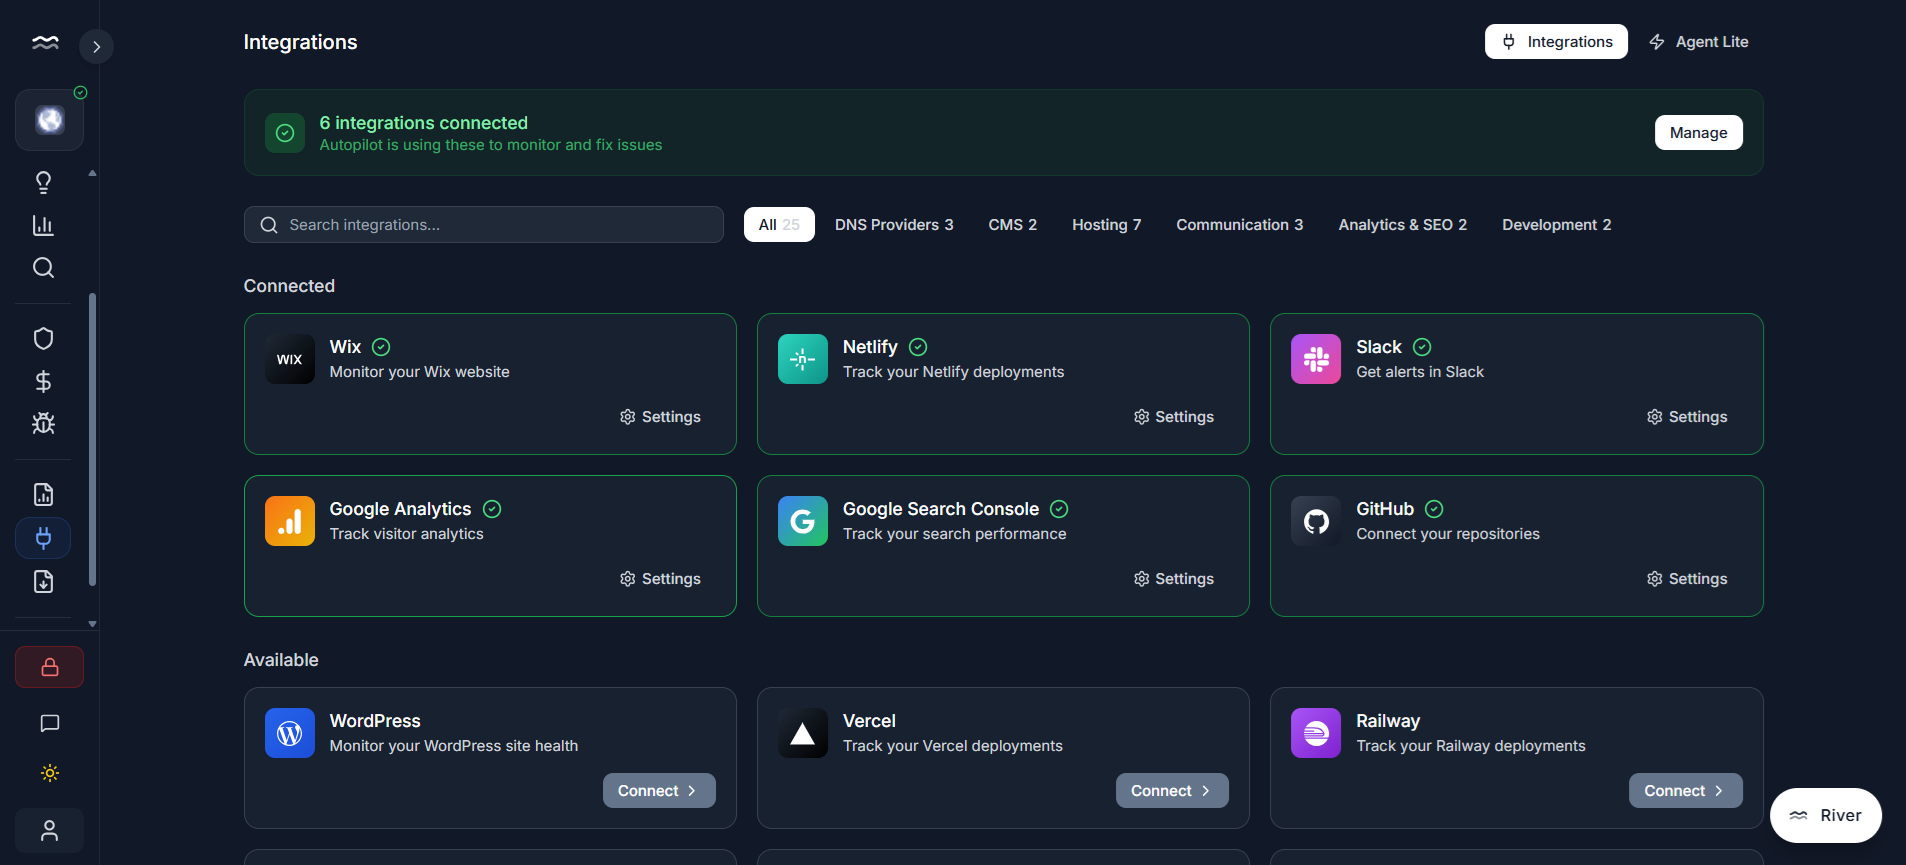
Grove Intelligence

See why things happen

Your website generates data. Your business generates data. Grove connects them - revealing which actions actually move the needle, based on your data, not generic advice.

Revenue
Goal
Traffic
Ads
SEO
Email

Insight: Traffic correlates 0.87 with revenue. A 10% traffic increase predicts +$4,200/month.

How It Works

From scattered data to clear answers

Connect your data

Website metrics flow in automatically from LinkRivers. Add business data by uploading CSVs, connecting integrations, or entering values manually. Shopify sales, QuickBooks revenue, email subscribers - all in one place.

Discover correlations

Grove automatically finds relationships in your data. Not guesses - statistically significant correlations with confidence scores. "Traffic correlates 0.85 with revenue" or "Page speed affects bounce rate by -0.72".

Set and track goals

Define measurable goals like "Increase revenue by $50k" or "Reduce bounce rate to 30%". Grove shows you which levers actually move you toward each goal, ranked by impact.

Ask what-if questions

"If I increase ad spend by $500, what happens to revenue?" Grove answers based on YOUR historical data, not industry averages. Projections you can trust because they come from your own patterns.

Capabilities

Intelligence that learns your business

Auto-discovered correlations

Grove continuously analyzes your data to find relationships. When traffic spikes correlate with revenue, or slow pages correlate with cart abandonment, you'll know.

Anomaly detection

Traffic jumped 40% yesterday? Grove detects it and asks what happened. Create events (campaigns, launches, incidents) that explain the anomaly and inform future predictions.

Goal-oriented paths

Set a revenue goal. Grove shows you the paths to get there - ranked by impact and confidence. Focus on what actually works for YOUR business.

What-If projections

Model scenarios before committing. "What if I run another sale like last Black Friday?" Grove uses your historical data to project likely outcomes.

External factor analysis

Weather affects your roofing business. Holidays affect your e-commerce. Grove factors in external data you can't control but need to understand.

Visual knowledge graph

See your entire business as connected entities - websites, goals, campaigns, products. Relationships visualized, not buried in spreadsheets.

Use Cases

Questions Grove answers

"Why did revenue drop last month?"

Grove traces back through correlated metrics to find the root cause - was it traffic, conversion rate, ad spend, or something else?

"What should I focus on to hit my Q2 goal?"

Grove ranks your options by impact. Maybe email converts better than ads for your business. Maybe page speed matters more than you thought.

"Should I increase my ad budget?"

Grove shows the historical relationship between your ad spend and revenue. Not industry benchmarks - your actual ROI pattern.

"What caused that traffic spike?"

Grove detects anomalies and prompts you to explain them. Build a history of events that inform future predictions.

Stop guessing.
Start knowing.

Connect your data. Let Grove find the patterns. Make decisions based on what actually works for your business.

Get Started